Greg Edwards

I'm a transport planner with a background in applied GIS and urban analytics. My interests lie at the intersect of spatial analysis, cities, and urban policy and the use of data to solve city challenges.
Currently working as an Associate Consultant for Beca Ltd, based in Nelson (New Zealand/Aotearoa).
View My LinkedIn ProfileCheck out some of my projects below👇
Data Analysis & Modelling (Python, R)
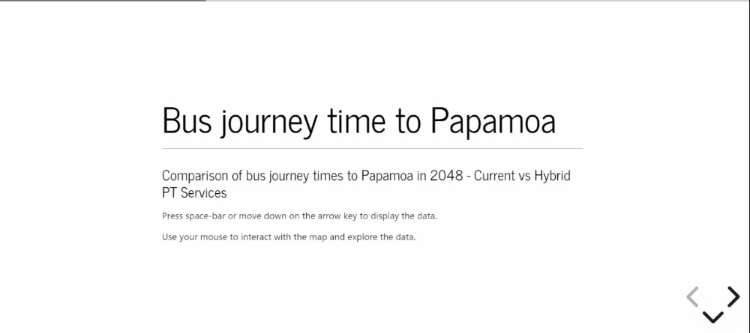
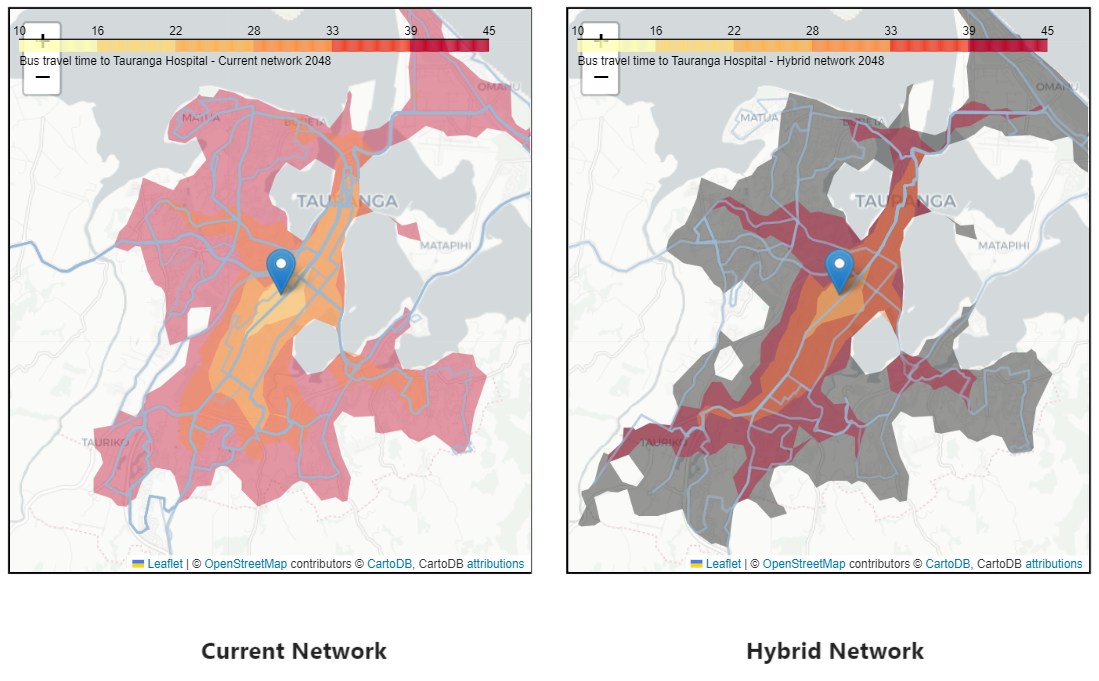
Modelling Changes in Journey Time Accessibility by Public Transport
The aim of this model was to forecast and better understand how bus journey times change in response to different bus services, frequencies, and bus priority infrastructure. Broadly, it aimed to understand how accessibility, measured by travel time, would change under different scenarios. Travel time matrices were developed for each scenario, building on forecast land use and employment changes and the impact of planned bus priority infrastructure. The matrices were mapped via Python geospatial libraries for further analysis and client engagement.
Tools used: Python, QGIS, Pandas, Folium
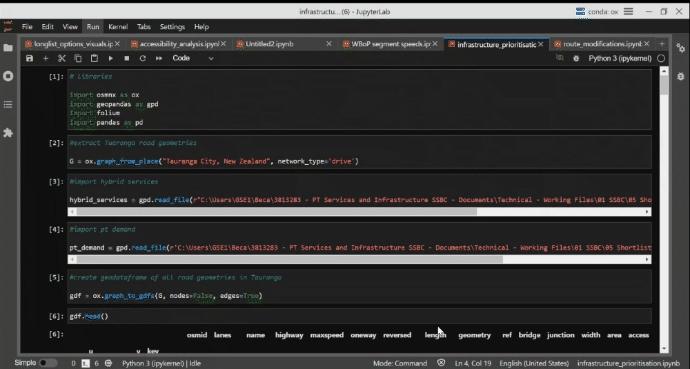
Infrastructure Prioritisation Using a Big Data Model
A persistent issue for governemnet agencies is how to identify urban locations that are best suited for capital investment. This model was developed to help identify to help identify promising locations for bus priority measures in the Western Bay of Plenty. An approach was developed to identify roads and road network segments where investment in bus priority could be implemented and a prioritisation process using a transparent methodology and consistent datasets. With the rich and varied libraries available, Python code was selected as the preferred method of pulling and analysing the data sets and performing the analysis. This has been combined with Jupyter Lab notebooks to provide further analysis and communication of the code. Finally, Folium, Leafmap, and KeplerGL were used to provide the interactive mapping component to show geographically where the investment could be targeted.
Tools used: Python, OSMnx, GeoPandas, Leaflet, JupyterLab, KeplerGL
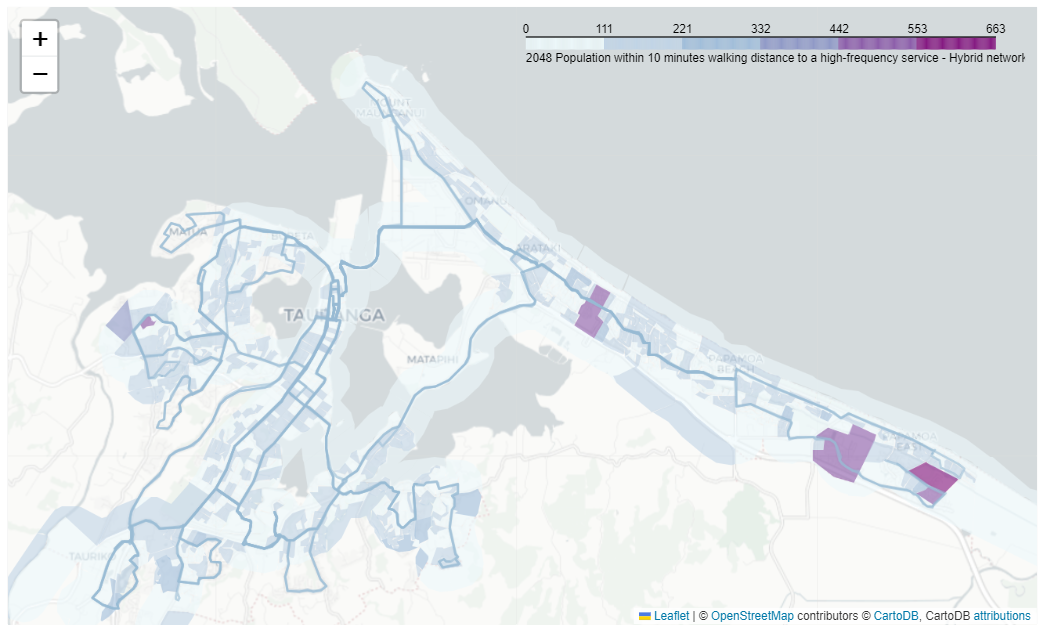
Forecasting Walking Time Access to High-Frequency Public Transport Services
Modification to future bus serivce operations and routes is likely to impact how easily the public transport network is to access by residents and the community. This analysis was used to understand how future access to the bus network would change over time. Geospatial analysis was undertaken using forecast changes to land use, employment, and housing density. Walking time isochrones were developed and evalusated in Pandas and further visualised through spatial plotting libraries.
Tools used: Python, QGIS, Pandas, Folium
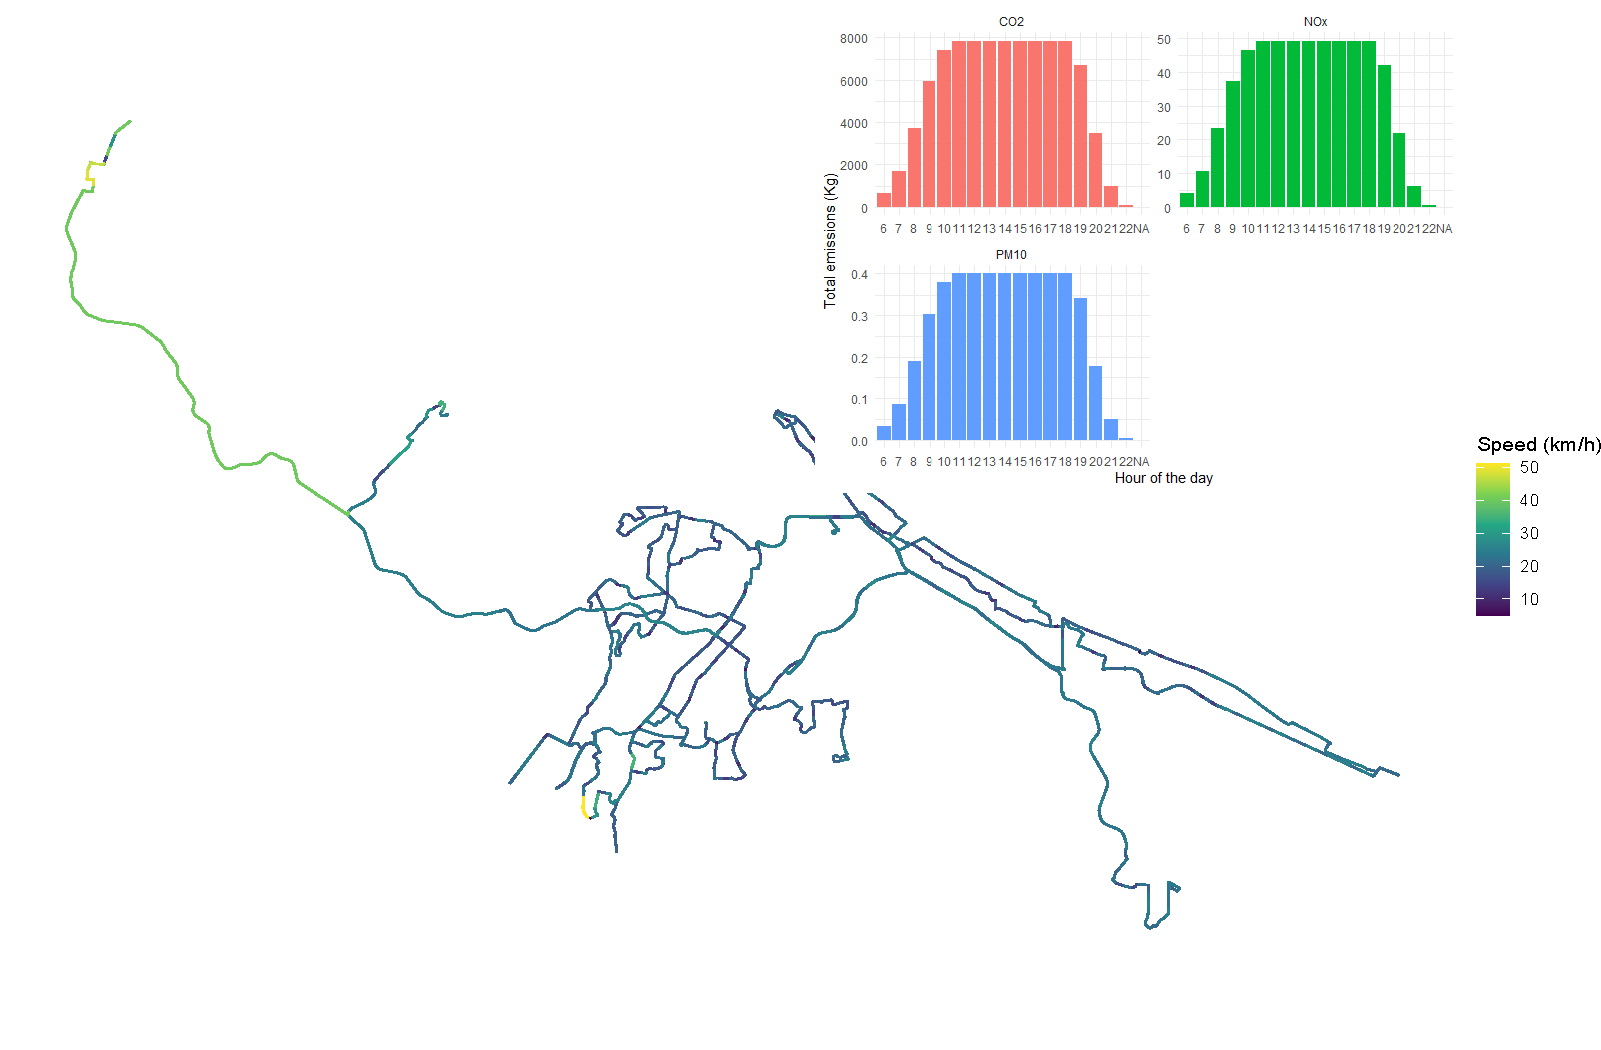
Estimating the Emissions of Plublic Transport Services and Operations
To understand the cumulative emissions generated from different bus service operations, a model was developed to estimate and evaluate the tailpipe emissions associated with different bus service scenarios developed for future operations in the Western Bay of Plenty. This involved using the European Environment Agency EMEP model, bus fleet data, and GTFS with R scripting to calculate CO2, Nox, and PM emissions associated with service operations. R plotting libraries were used to visualise the results and demosntrate the emissions profile by time of day and vehilce fleet.
Tools used: R, GGPlot2
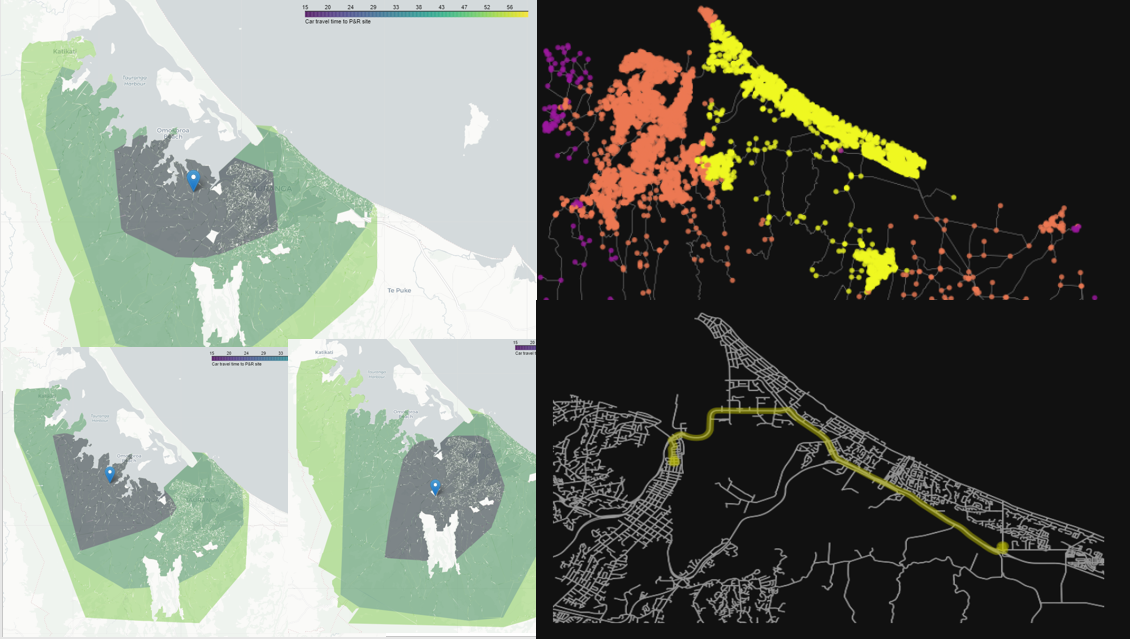
Predicting Park and Ride Journey Time Accessibility
Best practice suggests that the distance and travel time variant that an individual must undertake to drive to a park and ride facility is a significant determinant of the site’s usage. To understand the potential benefits of park and ride facilities, a model was developed to understand driving journey times to the park and ride site along with the potential market catchment using land use growth assumptions. For this analysis, it was assumed that a majority of the market share for each site would originate within a 30 minute or less vehicle travel time to the site. These outputs were combined with forecast (2048) population and dwelling estimates to determine the potential ‘market’ for each site. Dedicated express bus services were assumed connecting the site with the CBD and travel time analysis was undertaken to understand the journey time differential between car and bus. The results provided into subsequent value for money calculations for each site.
_Tools used: Python, OSMnx, Matplotlib
Visualisations & Web Applications
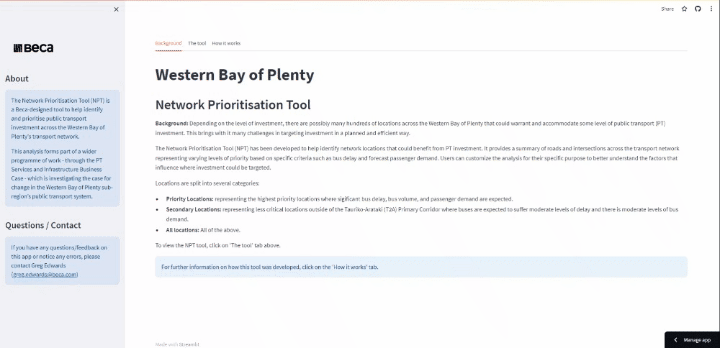
Visualising PT Priority Infrastructure Requirements
An interactive web application tool was develoepd to visualise and summaise prirotiy and secodnary locatiosn across the transport network that would be amenable to bus priority infrastructure.
Tools used: JavaScript, HTML, CSS, Python, Streamlit
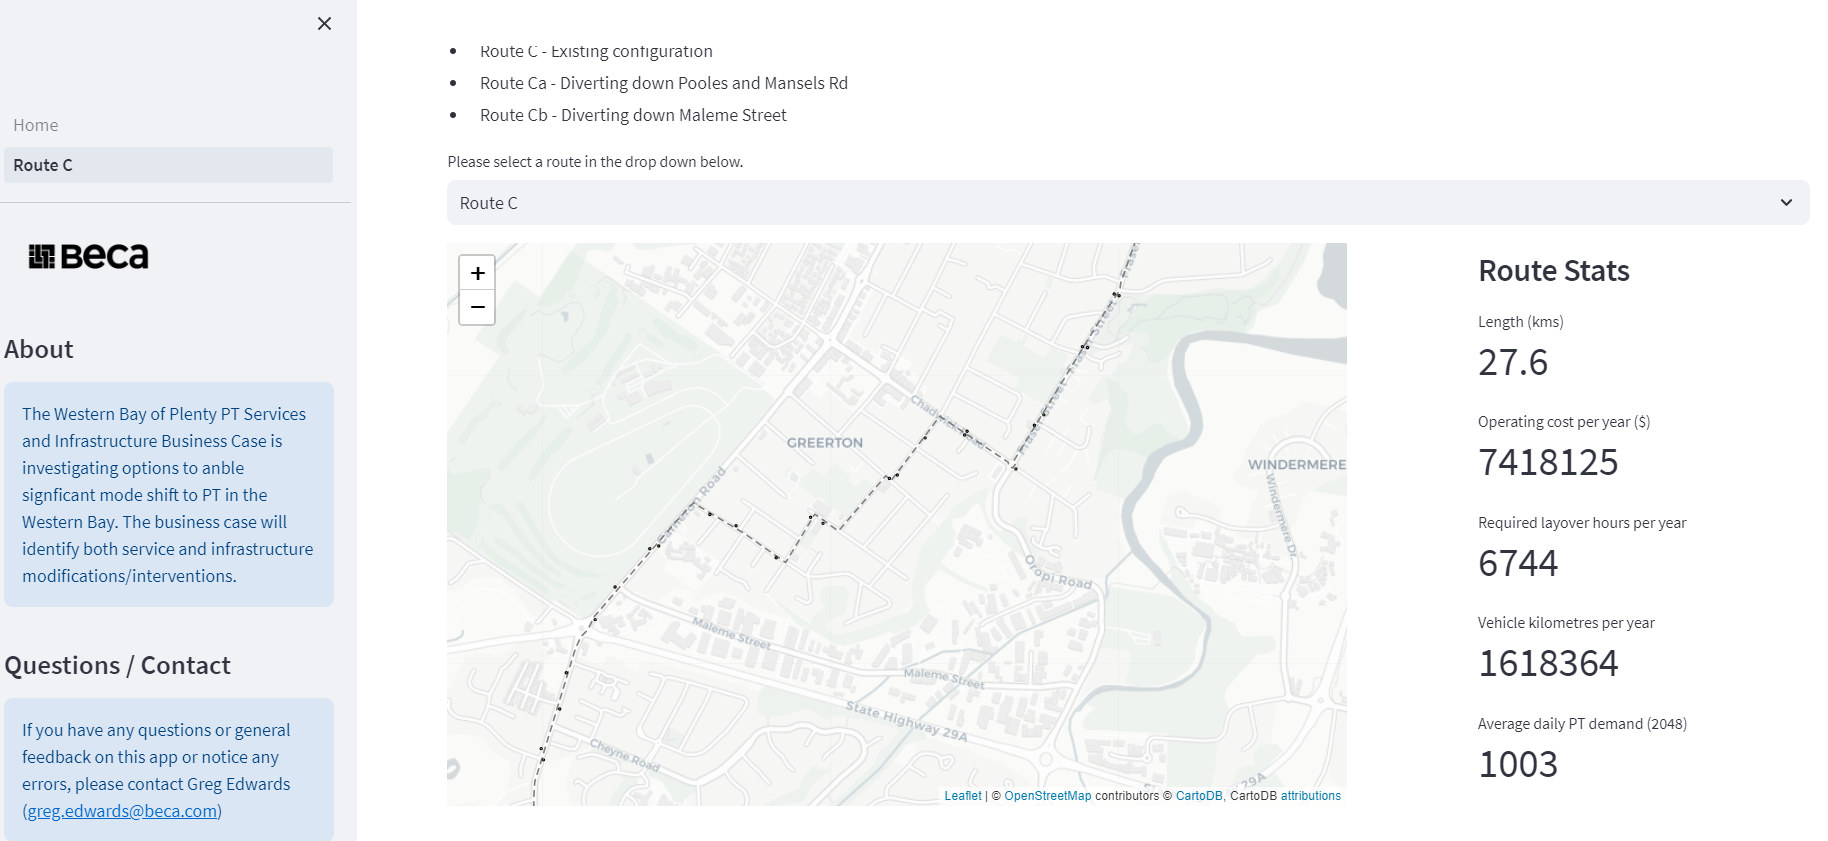
Understanding Changes to PT Service Modifications
This is a useful interactive web application tool that was created to visually illustrate changes to bus routes and other service modifications in the Western Bay of Plenty. Various route statistics are shown - such as route length, annual operating cost, kilometres driven per year, and forecast average daily PT demand - allowing the user to understand the wider imapacts that service modifications will have. The application is dynamically connected to the data sources, meaning that new data is refreshed with each option.
Tools used: JavaScript, HTML, CSS, Python, Streamlit
Interactive HTML Documents
This is a useful interactive web application tool that was created to visually illustrate changes to bus routes and other service modifications in the Western Bay of Plenty. Various route statistics are shown - such as route length, annual operating cost, kilometres driven per year, and forecast average daily PT demand - allowing the user to understand the wider imapacts that service modifications will have. The application is dynamically connected to the data sources, meaning that new data is refreshed with each option.
Tools used: Python, JupyterLab, HTML